Using WinDbg to Troubleshoot Windows System Errors
Installing the WinDbg Preview
- Open the Microsoft Store and search for WinDbg Preview.
- Alternatively, click here to view WinDbg Preview on the Microsoft Store Website: https://www.microsoft.com/store/productId/9PGJGD53TN86
- Click Get.
- If prompted, click Open the Microsoft Store.
- Click the WinDbg Preview search result when it appears.

- Click the Get or Install button.
- If prompted to Sign In, click Cancel or Close.
Opening a Dump File in WinDbg
- With the WinDbg Preview app open, click File then click Open dump file.
- On the right-hand side, click Browse.
- Find your Dump File and click Open.
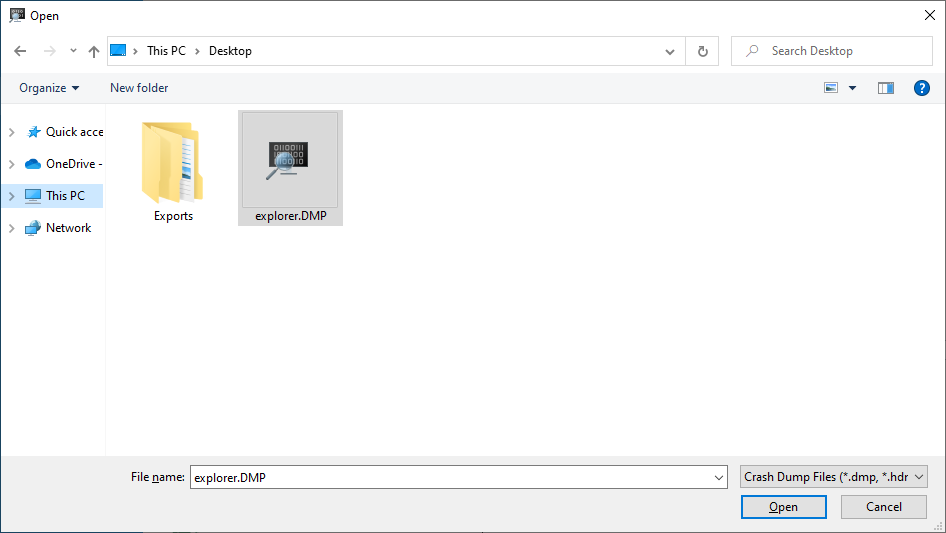
- Under the Browse button, click Open.
- The Dump File will now be loaded into WinDbg and the appropriate application modules will be downloaded.

Default Dump File Locations
Generally Dump files can be found in the C:\Windows\Minidump or C:\Windows\System32 directories.
Searching the C:\Windows directory for *.dmp can reveal the file locations.
Analyzing Dump Files
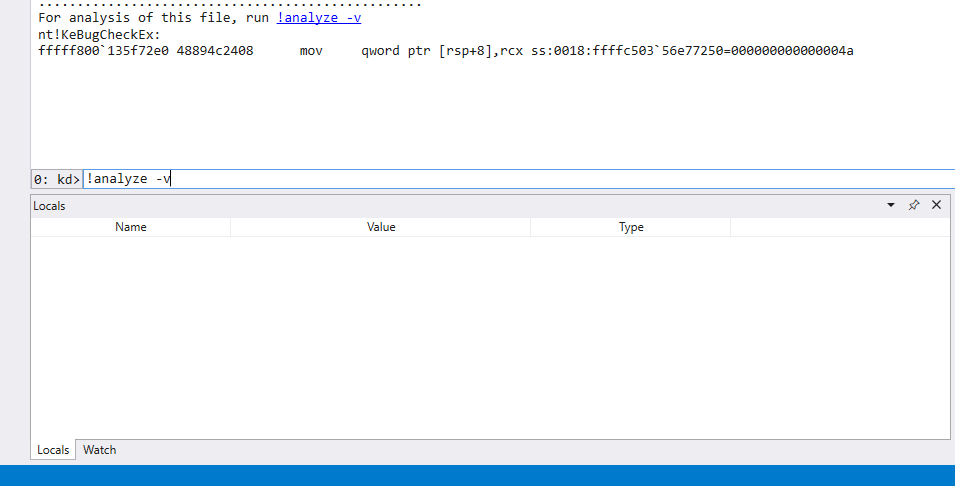
- With a Dump file open in WinDbg, click the !analyze -v link or type !analyze -v into the command box and press Enter.

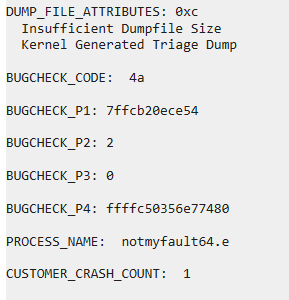
- Wait for the modules to download and the processing to finish. From here you can read through the Dump record. Researching the Process Name and Bug Check Code could result in a solution or fix for the crash.

No Comments